Translating Ideas Into Action
Every project tells a story of learning, building, and evolving.

Human Resources Analytics Dashboard – Adani Energy Solutions Limited
Developed an end-to-end Human Resources dashboard in Power BI covering key functions such as Learning & Development, Talent Acquisition, Industrial Relations, Master Data Management, and Attrition Analysis. Built a robust semantic data model to streamline data integration and improve reporting accuracy. The dashboard provided a unified, interactive view of HR metrics to support strategic, data-driven decision-making.
View Certificate
Skill Gap Application – Adani Energy Solution Limited
A skill gap analysis identifies the difference between employees’ current skills and the skills required to meet organizational goals. Collaborating with the Learning and Development team in Human Resources, I developed a Power Apps application to streamline this process. By integrating Power BI, Power Automate, SharePoint, and Excel, we created a cohesive system for capturing employee data, automating workflows, and visualizing skill gaps. The outcome was an efficient platform that provided clear insights into development needs, enabling data-driven planning for employee growth and organizational improvement.
View Certificate
Bidding to LOA Project Tracker
– Adani Energy Solution Limited
Worked on developing a dynamic "Bidding to LOA Project Tracker" using Power BI to monitor the progress of transmission projects from initial Bidding stages to final Letter of Allocation (LOA). The dashboard offered a centralized and up-to-date view of project statuses across different phases, helping teams track milestones, delays, and approvals efficiently. This solution enhanced transparency, streamlined reporting, and supported better decision-making across departments.
View Certificate

Admission Counselor Chatbot
Built an AI-powered chatbot using Natural Language Processing (NLP) and Deep Learning to assist students with common admission-related queries. The chatbot classifies user inputs into predefined intents using a neural network trained on cleaned and tokenized text data. This solution helps automate repetitive questions, reducing staff workload and improving student experience. Key tools used include Python, TensorFlow/Keras, NLTK, and JSON.
Discover more

Statistical Analysis of Student Performance in Chicago Schools
This project investigates how various school-related factors impact student performance using statistical analysis in R Studio. Leveraging the Chicago School Dataset, it focuses on key indicators such as Average Student Attendance, Family Involvement Score, and Rate of Misconducts to predict students' Math % scores. Multiple Linear Regression is applied to assess the influence of continuous variables, while ANOVA (Analysis of Variance) is used to determine the effect of categorical factors—such as School Type and Grade Level—by comparing mean Math scores across different groups.
Discover more

Energy Efficiency Modeling: Predicting Heating and Cooling Demand using Python
This project focuses on predicting the Heating Load (Y1) and Cooling Load (Y2) of buildings using machine learning techniques. By leveraging architectural and environmental features of structures, the model applies data preprocessing, Random Forest Regression, and Gradient Boosting Regression to achieve accurate predictions. The goal is to promote sustainable architecture by enhancing building energy efficiency through advanced data-driven machine learning models.
Discover more

Exploratory Data Analysis on Superstore Dataset using Python
This project focuses on Exploratory Data Analysis (EDA) of the Superstore sales dataset using Python in Jupyter Notebook. Leveraging powerful libraries like Pandas, Matplotlib, and Seaborn, I analyzed sales, profit trends, regional performance, shipping modes, and customer segments. The goal was to uncover hidden patterns, business insights, and growth opportunities through detailed visualizations and statistical summaries.
Discover more

Sales Analysis using Power BI
This project focuses on analyzing sales data through interactive report built in Power BI. Key performance indicators such as total sales, profit trends, shipping modes, regional performance, and customer segments are visualized to generate actionable business insights. The analysis highlights top-performing products, high-profit regions, and helps uncover opportunities to improve overall sales performance.
Discover more
Analysis of Airbnb Dataset Using Python
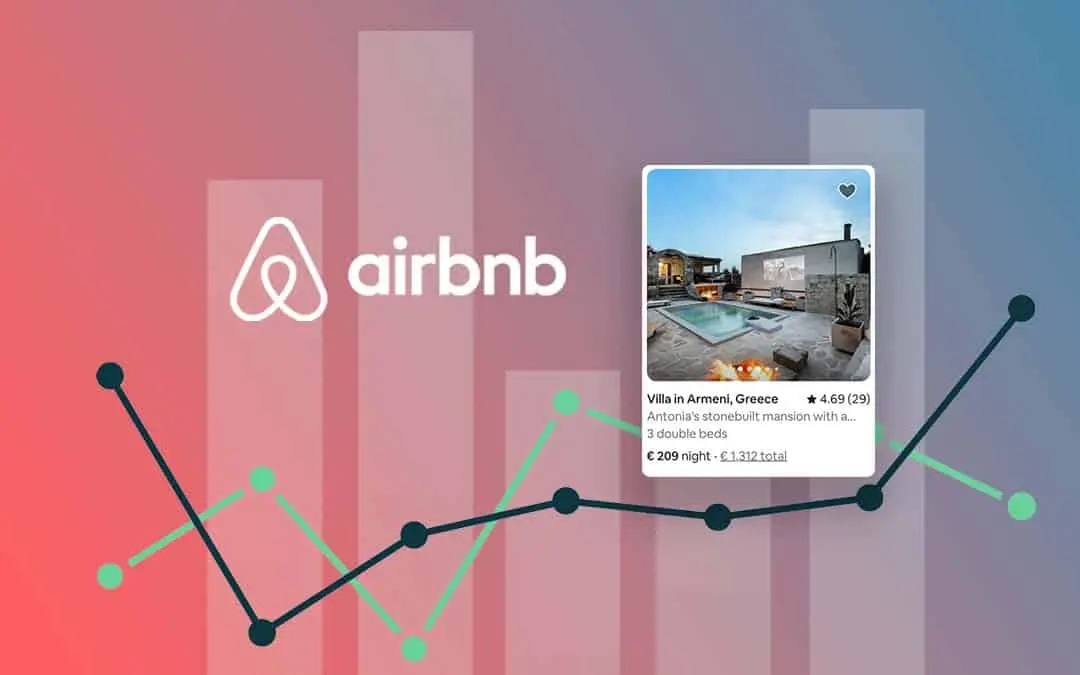
Performed extensive data cleaning, preprocessing, and interactive visualization on a real-world Airbnb dataset using Python. Focused on uncovering trends related to prices, availability, reviews, and geographical distribution to provide actionable insights. Tools used include Pandas, NumPy, Matplotlib, Seaborn, and Plotly. Discovered key insights such as price variations across neighborhoods, impact of reviews on booking rates, and seasonal availability patterns.
Discover more

Global YouTube Dataset Analysis using Power BI
This project presents an interactive Power BI report based on a global YouTube dataset containing video statistics from multiple countries. The dashboard provides insights into top-performing channels, most viewed videos, likes vs dislikes trends, category-wise performance, and country-wise viewer engagement. By leveraging data visualizations, filters, and KPIs, the report helps uncover content trends, audience preferences, and factors contributing to viral success on YouTube.
Discover more

Olympic Games SQL Project – 120 Years of Athlete History
SQL-based data analysis project using a comprehensive Olympic dataset covering athlete and medal records from Athens 1896 to Rio 2016. The project involved designing and querying a relational database containing athlete bio-data, event details, and country information. Two structured tables—athletes_event and noc_region—were used to derive insights on athlete performance, medal distribution, country participation, and trends across seasons. This project showcased strong SQL skills in data organization, relationship mapping, and complex query writing to uncover meaningful historical patterns in Olympic data.
Discover more